
! If you open the PDF in a browser instead of the ADOBE app for printing, you need to go to more settings, select scale as - 'Fit to page' before printing.
COMPARE > Compare Schools - > Compare Districts - > Theme check_circle > School District Location
school school location_city> Compare Schools - > Compare Districts - > more_vert > Themes check_circle AZ School Report Cards chevron_left
You added this school ( <> of 3 ) to your Compare list ! You have already added <> schools to your compare list
Remove a school to add this one - Manage Schools You have already added <> schools to your compare list
Remove a school to add this one - Manage Schools You added this district ( > of 3 ) to your Compare list ! You have already added > districts to your compare list
Remove a district to add this one - Manage Districts You have already added > districts to your compare list
Remove a district to add this one - Manage Districts
Release Notes View Release Notes expand_less expand_less > Close
View Comparison View Comparison
A few quick facts about Arizona’s K-12 education system:
A few quick facts about Arizona’s K-12 education system:
A-F Letter Grades: Arizona Revised Statutes § 15-241 requires the Arizona Department of Education, subject to final adoption by the State Board of Education, to develop an annual achievement profile for every public school in the state based on an A through F scale. The development of the Accountability System was informed by public input through 17 public hearings across the state and a survey that yielded almost 1,700 responses. Additionally, a broad-based committee consisting of school administrators, teachers, parents and data experts provided the Board with further input.
Each school’s A-F Letter Grade profile also includes the proficiency and academic growth of English language learners, indicators that an elementary student is ready for success in high school, measures of high school students’ readiness to succeed in a career or higher education, and high school graduation rates.
The plan adopted by the Board complies with state statute and the federal Every Student Succeeds Act while recognizing the opportunity to measure the quality of a school and its effectiveness across a broader range of measures than in the past.
In March of the 2019-2020 school year, all Arizona school campuses were closed due to the COVID-19 pandemic. As a result, the Arizona State Board of Education, acting on passed state legislation, voted not to administer the statewide assessments, and to carry a school's 2018-2019 A-F letter grade forward for the 2019-2020 school year. This decision was in keeping with a waiver granted by US Department of Education.
Normally, Arizona calculates A-F letter grades for eligible schools annually. A.R.S. § 15-741 Section 2 prohibits ADE from assigning letter grades for the 2020-2021 school year. However, the data from this year that is used in calculating A-F components is particularly important for understanding the academic impact of COVID. Care should be taken when making direct comparisons of data in the A-F calculations with previous years, otherwise inferences may be invalid.
More Info More Info More Info More Info More Info
Federal Accountability OverviewThe Federal Every Student Succeeds Act (ESSA) requires states to identify schools for Comprehensive Support and Improvement (CSI) for overall low student achievement or low graduation rate and Targeted Support and Improvement Schools (TSI) for low subgroup achievement. Schools are identified every three years.
In March of the 2019-2020 school year, all Arizona school campuses were closed due to the COVID-19 pandemic. As a result, the US Department of Education retained existing CSI and TSI school designations for the 2019-2020 school year. This decision was in keeping with a waiver granted by US Department of Education.
In the 2020-2021 school year, Arizona schools continued to adjust to the COVID-19 pandemic and impact to students. As a result, the US Department of Education retained existing CSI and TSI school designations for the 2019-2020 and 2020-2021 school year. This decision was in keeping with a waiver granted by US Department of Education.
The Federal Every Student Succeeds Act (ESSA) requires states to identify schools for Comprehensive Support and Improvement (CSI) for overall low student achievement and low graduation rate, Additional Targeted Support and Improvement Schools (ATSI) for low subgroup achievement, and Targeted Support and Improvement (TSI) for schools with consistently underperforming subgroups.
The Federal Every Student Succeeds Act (ESSA) requires states to identify schools for Comprehensive Support and Improvement (CSI) for overall low student achievement and low graduation rate, Additional Targeted Support and Improvement Schools (ATSI) for low subgroup achievement, and Targeted Support and Improvement (TSI) for schools with consistently underperforming subgroups.
More Info More Info More Info More Info Information close Career & Technical Education District (CTED) is a school district that offers high school career and technical education programs to partner districts
Student Achievement Participation Rates: State Academic AssessmentThis section displays information on the percentage of students taking a state mandated assessment.
bar_chart Chart list DataDue to COVID-19, assessment participation rates were lower than previous years, which means fewer students were assessed than normal.
To see data on the percentage of students taking a state mandated assessment use the links below.
In March of the 2019-2020 school year, all Arizona school campuses were closed due to the COVID-19 pandemic. Although instruction continued for Arizona students, the state academic assessment was not administered.
Students with Significant Cognitive Disabilities Participation Rates: Alternate AssessmentThis section displays information on number and percentage of students taking an Alternate Assessment. Arizona’s Alternate Assessment System consists of the Multi-State Alternate Assessment (MSAA) which is administered in Grades 3-8 and 11 in the content areas of ELA and Mathematics; and Science which is administered in grades 4, 8 and 10. These assessments are designed for students with significant cognitive disabilities and measures academic content that is aligned to the State’s Content Standards at their enrolled grade level.
In order for a student to participate in either of these Alternate Assessments, the student’s IEP Team must annually review the Alternate Assessment Eligibility Criteria and determine if the student meets all of the criteria to participate.
For participation guidelines and eligibility determination Click here.
bar_chart Chart list DataIn March of the 2019-2020 school year, all Arizona school campuses were closed due to the COVID-19 pandemic. Although instruction continued for Arizona students, the alternate state academic assessment was not administered.
Preschool Progress MonitoringArizona's State Board of Education-approved tool for ongoing progress monitoring of preschool aged children is Teaching Strategies GOLD (TSG). Data collected through the use of this valid and reliable assessment tool helps to inform instruction and lesson planning as well as provides information routinely to address individual needs of children. This information assists educators in identifying where a child is in relation to their optimal development. Arizona assesses its progress towards identifying the school-readiness levels of children through the use of TSG.
This data below shows percentage of preschool and pre-kindergarten children meeting or exceeding age level expectations. Pre-kindergarten is one year before kindergarten and preschool is two years before kindergarten.
bar_chart Chart list Data
No data available| Percentage meeting or exceeding age level expectations (%) |
Least Restrictive Environment.
Includes preschool/kindergarten children with disabilities - ages 3 to 5. Depending on the birth-date of a child that is five years old, he or she may be enrolled in Kindergarten or preschool.
This is also known as the Office of Special Education Programs (OSEP) Federal Indicator 6.
This shows data reported for Indicator 6 in the Individuals with Disabilities Education Act Part B State Performance Plan/Annual Performance Report.For more details click here.
Below shows the percent of Preschool/Kindergarten children with IEPs (Individualized Education Programs) who received special education and related services in specific settings.
Least Restrictive Environment (LRE) for Preschool Students with DisabilitiesThis shows data reported for preschool students with disabilities receiving special education services over October 1. This data is collected through the Exceptional Student Services October 1 Data Collection.
Below shows the percent of different LRE groups for special education preschool students.
bar_chart Chart list Data
No data available| Percentage of Children in each setting (%) |
Every Student Succeeds Act (ESSA) requires states to set long term goals in order to measure student progress towards proficiency (English, math), graduation, English Learners, and other components.
*In 2017, Arizona changed its methodology for determining EL subgroup graduation rate.The graduation rate was determined by the number of 12th grade students who were still classified as EL students who graduated with their cohort. In 2017, this rate was determined by assessing the number of EL students who were ever classified during high school as EL and graduated with their cohort.
Graduation Rate: Actual vs Goals bar_chart Chart list Data Long Term Goals and Measure of Interim Progress: ProficiencyEvery Student Succeeds Act (ESSA) requires states to set long term goals in order to measure student progress towards proficiency (English, math), graduation, English Learners, and other components.
1) ESSA goals were set when “End of Course” assessments were available at the high school level. In 2020-2021 the state moved to only one assessment. Goals will be reset.
Proficiency: Actual vs Goals bar_chart Chart list Data ELA Math1. Gray Bar – When a subgroup in this report has 10 or fewer students, showing the achievement information may risk an individual student’s anonymity. In this case, we do not report any achievement results for that subgroup.
2. When all students in a subgroup score at the same performance level, reporting “100%” or “0%” would violate each student’s anonymity. To protect students' anonymity, we report the percent passing as "97%". Likewise, we report the percent passing as "2%" if either 1% or 0% of students in a group pass.
3. ESSA goals were set when “End of Course” assessments were available at the high school level. In 2020-2021 the state moved to only one assessment. Goals will be reset.
School year 2020-2021 assessment results should be reviewed cautiously as there were several impacts from COVID-19. Due to COVID-19, assessment participation rates were lower than previous years, which means fewer students were assessed than normal. It is also important to remember that the learning disruptions from COVID-19 may have impacted student learning and assessment results.
1. When all students in a subgroup score at the same performance level, reporting “100%” or “0%” would violate each student’s anonymity. To protect students' anonymity, we report the percent passing as "97%". Likewise, we report the percent passing as "2%" if either 1% or 0% of students in a group pass.
2. ESSA goals were set when “End of Course” assessments were available at the high school level. In 2020-2021 the state moved to only one assessment. Goals will be reset.
School year 2020-2021 assessment results should be reviewed cautiously as there were several impacts from COVID-19. Due to COVID-19, assessment participation rates were lower than previous years, which means fewer students were assessed than normal. It is also important to remember that the learning disruptions from COVID-19 may have impacted student learning and assessment results.
In March of the 2019-2020 school year, all Arizona school campuses were closed due to the COVID-19 pandemic. As a result, the US Department of Education did not require the administration of state assessments. Therefore, the previous year's data is presented. This decision was in keeping with a waiver granted by US Department of Education.
Goal Plans State Result on NAEP Compared to National AverageThe National Assessment of Educational Progress (NAEP) is the only assessment that measures what U.S. students know and can do in various subjects across the nation, states, and in some urban districts. Also known as The Nation’s Report Card, NAEP has provided important information about how students are performing academically since 1969. For more information on NAEP click here.
bar_chart Chart list DataComprehensive Support and Improvement Schools-Low Achievement (CSI-LA) are the lowest-performing 5% (minimum) of all schools receiving Title 1 funds.
Comprehensive Support and Improvement – Low Graduation Rate (CSI-G) are any high schools failing to graduate two-thirds or more of their students.
All federally identified schools are required to complete the Comprehensive Needs Assessment (CNA) and Integrated Action Plan (IAP) to improve student achievement and/or graduation rates, as well as monitoring and support protocols.
Strategies Implemented
Number of Schools Currently Identified for Comprehensive Support and Improvement (CSI) - Low Achievement : >
All Comprehensive Support and Improvement-Low Achievement Schools are expected to exit within four years of identification. If not, they will then be subject to more rigorous State-determined action.
Number of Schools Currently Identified for Comprehensive Support and Improvement (CSI) - Low Graduation Rate: > Number of Schools Currently Identified for Comprehensive Support and Improvement (CSI) : >
Additional Targeted Support and Improvement Schools (ATSI) are the schools that were first identified for SY 2018-19, based on Spring 2018 AzMERIT scores. They are any school with any subgroup of students, that on its own, would lead to identification as a Comprehensive Support and Improvement School. They are reidentified every three years. If they don’t meet exit criteria by the end of the 4th year, they become Comprehensive Support and Improvement Schools.
Additional Targeted Support and Improvement (ATSI) Schools:Additional Targeted Support and Improvement (ATSI) designations are calculated using the CSI criteria described below applied to each individual subgroup with an N-size of 20 or more.
The major subgroups are as follows:
Strategies Implemented
Any Title 1 ATSI school that does not exit after four years, is identified as a Comprehensive Support and Improvement School-Low Achievement.
Targeted Support and Improvement (TSI) Schools:Targeted Support and Improvement Schools (TSI) are any school in which any subgroup is two standard deviations below the statewide mean of all students during the prior three years of most current data.
All schools may be identified for TSI, regardless of Title 1 status. TSI identification occurs annually. Initial identification occurred in the Fall of 2022, using data from the 2021-2022, 2018-2019, and 2017-2018 school years. TSI schools are identified annually, therefore there are no exit criteria.
Strategies Implemented
The grey bar that appears on this graph indicates potential impact from the COVID-19 pandemic which may impact how trends can be evaluated.
Traditionally, unexcused absences greater than 10 days identify a student as having dropped out until they have a subsequent enrollment. School year 2020-2021 dropout rates may have been affected by changes in attendance tracking and modes of instruction that occurred due to the COVID-19 pandemic.
No trend data available No trend data availableEL-FEP includes students who are current English Learners and students who were formerly identified as an EL student within the past four years and have since tested proficient on the English Learner assessment.
Due to COVID-19, the percent of students identified as chronically absent in the 2020-2021 school year may differ when compared to other years due to adjustments in how attendance data was collected by schools.
* When a subgroup in this report has 10 or fewer students, showing their information may risk an individual student's anonymity. In these cases, we take care to hide either the number of students reported, the percentage, or both, and show * symbols instead. Similarly, when all students in a subgroup possess the same information, reporting 100% or 0% would violate each student’s anonymity. To protect students’ anonymity, we do not report percentage values above 98 or below 2.
* When a subgroup in this report has 10 or fewer students, showing their information may risk an individual student's anonymity. In these cases, we take care to hide either the number of students reported, the percentage, or both, and show * symbols instead. Similarly, when all students in a subgroup possess the same information, reporting 100% or 0% would violate each student’s anonymity. To protect students’ anonymity, we do not report percentage values above 98 or below 2.
In March of the 2019-2020 school year, all Arizona school campuses were closed due to the COVID-19 pandemic. Although instruction continued for Arizona students, attendance tracking may have been affected and impacted Chronic Absenteeism percentages.
No data available English Learners (EL) Achieving English Language ProficiencyThe Arizona Department of Education (ADE) has developed English Language Proficiency (ELP) Standards for English Learners attending either a public district school or public charter school in Arizona. These standards help measure student progress in English Language proficiency and provide classroom teachers with goals to help focus instruction. The Arizona ELP Standards help students gain the language knowledge needed to meet the language demands and complexity of math, science, and social studies. A student achieves proficiency by reaching certain benchmarks on the Arizona English Language Learner Assessment (AZELLA), Arizona’s assessment that measures student English language development.
bar_chart Chart trending_up Trend list DataThe grey bar that appears on this graph indicates potential impact from the COVID-19 pandemic which may impact how trends can be evaluated.
The grey bar that appears on this graph indicates potential impact from the COVID-19 pandemic which may impact how trends can be evaluated.
In March of the 2019-2020 school year, all Arizona school campuses were closed due to the COVID-19 pandemic. Although instruction continued for Arizona students, some English Learner students may not have had the opportunity to take the English Proficiency (AZELLA) assessment.
During the 2020-2021 school year due to COVID-19, the Office of English Language Acquisition Services (OELAS) waived the requirement for students to have a placement test in order to receive EL program services. The AZELLA results do not report the results of students who scored as initially proficient on their first AZELLA test. Consequently, these results do not include the AZELLA results of those students who received EL program services without a placement test but did score as initially proficient on their spring reassessment. Therefore, this data may be presenting a biased picture of the performance on the AZELLA test.
Growth PerformanceSchools serving grades K-8 were eligible for the Growth indicator of the A-F State Accountability model if they had enough qualifying data points. Growth is determined using student growth percentiles, a ranking from 1 to 99 that explains a student's academic progress on the statewide assessments in Math and English Language Arts as compared to his/her academic peers. Academic peers are determined based on a student’s previous scoring history.
Schools were eligible for the Growth indicator of the A-F State Accountability model if they had enough qualifying data points. Growth is determined using student growth percentiles, a ranking from 1 to 99 that explains a student's academic progress on the statewide assessments in Math and English Language Arts as compared to his/her academic peers. Academic peers are determined based on a student’s previous scoring history.
An elementary school has the capacity to earn a maximum of 50 growth points in the A-F State Accountability system. Those points are derived from Mathematics and English Language Arts growth scores. For more details on the A-F State Accountability System click here.
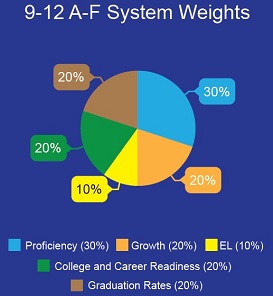
A high school has the capacity to earn a maximum of 20 growth points in the A-F State Accountability System. Those points are derived from Mathematics and English Language Arts growth scores. For more details on the A-F State Accountability System click here.
A K-12 school has the capacity to earn a combination of elementary and high school growth points in the A-F State Accountability system based on a proportion of its student population. Those points are derived from Mathematics and English Language Arts growth scores. For more details on the A-F State Accountability System click here.
During the 2022-2023 school year, schools serving grades 9-12 were not eligible for Growth and were instead evaluated using the Subgroup Improvement indicator.
Student Growth categories are determined using student growth percentiles, a ranking from 1 to 99 that explains a student's academic progress on the statewide assessments in Math and English Language Arts as compared to his/her academic peers. Academic peers are determined based on a student’s previous scoring history.
stacked_bar_chart Median bar_chart Chart list Data
Gray Bar - When a subgroup in this report has 10 or fewer students, showing their information may risk an individual student's anonymity. In these cases, we take care to hide either the number of students reported, the percentage, or both, and show * symbols instead.
When a subgroup in this report has 10 or fewer students, showing their information may risk an individual student's anonymity. In these cases, we take care to hide either the number of students reported, the percentage, or both, and show * symbols instead.
Growth Performance A-F Points Earned: > (Out of 20) (Out of 50/20) (Out of 50)
Normally, Arizona calculates A-F letter grades for eligible schools annually. A.R.S. § 15-741 Section 2 prohibits ADE from assigning letter grades for the 2020-2021 school year. However, the data from this year that is used in calculating A-F components is particularly important for understanding the academic impact of COVID. Care should be taken when making direct comparisons of data in the A-F calculations with previous years, otherwise inferences may be invalid.
In March of the 2019-2020 school year, all Arizona school campuses were closed due to the COVID-19 pandemic. As a result, the Arizona State Board of Education, acting on passed state legislation, voted not to administer the statewide assessments, and to carry a school's 2018-2019 A-F letter grade forward for the 2019-2020 school year. This decision was in keeping with a waiver granted by US Department of Education.
Preschool Child OutcomesPercent of preschool children with IEPs (Individualized Education Programs) who demonstrate improved:
a. Positive social-emotional skills (including social relationships),
b. Acquisition and use of knowledge and skills (including early language/communication and early literacy), and
c. Use of appropriate behaviors to meet their needs.
This shows data reported for Indicator 7 in the individuals with Disabilities Education Act Part B State Performance Plan/Annual Performance Report.
bar_chart Chart list Data
Note:
* In July of 2017 Teaching Strategies Gold changed their calculation methodology, which impacted the results in the following school year. Because of this, data comparisons for SY 13-14 through SY 16-17 may be made, but SY 17-18 represents a new standard of measure. Comparisons will be able to be made regarding SY 17-18 and future school year data going forward.
Preschool Child Outcomes: Data Trends Over Past 5-years
Note:
* In July of 2017 Teaching Strategies Gold changed their calculation methodology, which impacted the results in the following school year. Because of this, data comparisons for SY 13-14 through SY 16-17 may be made, but SY 17-18 represents a new standard of measure. Comparisons will be able to be made regarding SY 17-18 and future school year data going forward.
The "Four-year graduation rate" is the percentage of students who graduated within the first 4 years of enrolling in high school.
bar_chart Chart trending_up Trend list Data compare_arrows Comparison No data available
A-F Graduation Points Earned (Out of 10) (Out of 10) (Out of 20)
A-F Subgroup Graduation Rate Improvement Points Earned (Out of 5)
Gray Bar - When a subgroup in this report has 10 or fewer students, showing their information may risk an individual student's anonymity. In these cases, we take care to hide either the number of students reported, the percentage, or both, and show * symbols instead. Similarly, when all students in a subgroup possess the same information, reporting 100% or 0% would violate each student’s anonymity. To protect students’ anonymity, we do not report percentage values above 98 or below 2.
Gray Bar - When a subgroup in this report has 10 or fewer students, showing their information may risk an individual student's anonymity. In these cases, we take care to hide either the number of students reported, the percentage, or both, and show * symbols instead. Similarly, when all students in a subgroup possess the same information, reporting 100% or 0% would violate each student’s anonymity. To protect students’ anonymity, we do not report percentage values above 98 or below 2.
EL-FEP includes students who are current English Learners and students who were formerly identified as an EL student within the past four years and have since tested proficient on the English Learner assessment.
* When a subgroup in this report has 10 or fewer students, showing their information may risk an individual student's anonymity. In these cases, we take care to hide either the number of students reported, the percentage, or both, and show * symbols instead. Similarly, when all students in a subgroup possess the same information, reporting 100% or 0% would violate each student’s anonymity. To protect students’ anonymity, we do not report percentage values above 98 or below 2.
* When a subgroup in this report has 10 or fewer students, showing their information may risk an individual student's anonymity. In these cases, we take care to hide either the number of students reported, the percentage, or both, and show * symbols instead. Similarly, when all students in a subgroup possess the same information, reporting 100% or 0% would violate each student’s anonymity. To protect students’ anonymity, we do not report percentage values above 98 or below 2.
EL-FEP includes students who are current English Learners and students who were formerly identified as an EL student within the past four years and have since tested proficient on the English Learner assessment.
Select All No trend data available Four Year Graduation RateThe "Four-year graduation rate" is the percentage of students who graduated within the first 4 years of enrolling in high school.
No data available No trend data availableA-F Graduation Points Earned (Out of 10) (Out of 10) (Out of 20)
A-F Subgroup Graduation Rate Improvement Points Earned (Out of 5)
Gray Bar - When a subgroup in this report has 10 or fewer students, showing their information may risk an individual student's anonymity. In these cases, we take care to hide either the number of students reported, the percentage, or both, and show * symbols instead. Similarly, when all students in a subgroup possess the same information, reporting 100% or 0% would violate each student’s anonymity. To protect students’ anonymity, we do not report percentage values above 98 or below 2.
Dropout Rate bar_chart Chart trending_up Trend list Data compare_arrows Comparison
A-F Subgroup Dropout Rate Improvement Points Earned (Out of 5)
Gray Bar - When a subgroup in this report has 10 or fewer students, showing their information may risk an individual student's anonymity. In these cases, we take care to hide either the number of students reported, the percentage, or both, and show * symbols instead. Similarly, when all students in a subgroup possess the same information, reporting 100% or 0% would violate each student’s anonymity. To protect students’ anonymity, we do not report percentage values above 98 or below 2.
EL-FEP includes students who are current English Learners and students who were formerly identified as an EL student within the past four years and have since tested proficient on the English Learner assessment.
* When a subgroup in this report has 10 or fewer students, showing their information may risk an individual student's anonymity. In these cases, we take care to hide either the number of students reported, the percentage, or both, and show * symbols instead. Similarly, when all students in a subgroup possess the same information, reporting 100% or 0% would violate each student’s anonymity. To protect students’ anonymity, we do not report percentage values above 98 or below 2.
* When a subgroup in this report has 10 or fewer students, showing their information may risk an individual student's anonymity. In these cases, we take care to hide either the number of students reported, the percentage, or both, and show * symbols instead. Similarly, when all students in a subgroup possess the same information, reporting 100% or 0% would violate each student’s anonymity. To protect students’ anonymity, we do not report percentage values above 98 or below 2.
EL-FEP includes students who are current English Learners and students who were formerly identified as an EL student within the past four years and have since tested proficient on the English Learner assessment.
Traditionally, unexcused absences greater than 10 days identify a student as having dropped out until they have a subsequent enrollment. School year 2020-2021 dropout rates may have been affected by changes in attendance tracking and modes of instruction that occurred due to the COVID-19 pandemic.
In March of the 2019-2020 school year, all Arizona school campuses were closed due to the COVID-19 pandemic. Although instruction continued for Arizona students, attendance tracking may have been affected and impacted the 2020 dropout rates.
Select AllThe grey bar that appears on this graph indicates potential impact from the COVID-19 pandemic which may impact how trends can be evaluated.
EL-FEP includes students who are current English Learners and students who were formerly identified as an EL student within the past four years and have since tested proficient on the English Learner assessment.
Traditionally, unexcused absences greater than 10 days identify a student as having dropped out until they have a subsequent enrollment. School year 2020-2021 dropout rates may have been affected by changes in attendance tracking and modes of instruction that occurred due to the COVID-19 pandemic.
No trend data available Dropout Rate No trend data availableA-F Subgroup Dropout Rate Improvement Points Earned (Out of 5)
EL-FEP includes students who are current English Learners and students who were formerly identified as an EL student within the past four years and have since tested proficient on the English Learner assessment.
Gray Bar - * When a subgroup in this report has 10 or fewer students, showing their information may risk an individual student's anonymity. In these cases, we take care to hide either the number of students reported, the percentage, or both, and show * symbols instead. Similarly, when all students in a subgroup possess the same information, reporting 100% or 0% would violate each student’s anonymity. To protect students’ anonymity, we do not report percentage values above 98 or below 2.
End Of Year PromotionThis section displays information on the number and percentage of students who promote to the next grade or graduate from high school at the end of the school year.
bar_chart Chart list Data compare_arrows Comparison
Gray Bar: When a subgroup in this report has 10 or fewer students, showing their information may risk an individual student's anonymity. In these cases, we take care to hide either the number of students reported, the percentage, or both, and show * symbols instead. Similarly, when all students in a subgroup possess the same information, reporting 100% or 0% would violate each student’s anonymity. To protect students’ anonymity, we do not report percentage values above 98 or below 2.
* When a subgroup in this report has 10 or fewer students, showing their information may risk an individual student's anonymity. In these cases, we take care to hide either the number of students reported, the percentage, or both, and show * symbols instead. Similarly, when all students in a subgroup possess the same information, reporting 100% or 0% would violate each student’s anonymity. To protect students’ anonymity, we do not report percentage values above 98 or below 2.
* When a subgroup in this report has 10 or fewer students, showing their information may risk an individual student's anonymity. In these cases, we take care to hide either the number of students reported, the percentage, or both, and show * symbols instead. Similarly, when all students in a subgroup possess the same information, reporting 100% or 0% would violate each student’s anonymity. To protect students’ anonymity, we do not report percentage values above 98 or below 2.
* When a subgroup in this report has 10 or fewer students, showing their information may risk an individual student's anonymity. In these cases, we take care to hide either the number of students reported, the percentage, or both, and show * symbols instead. Similarly, when all students in a subgroup possess the same information, reporting 100% or 0% would violate each student’s anonymity. To protect students’ anonymity, we do not report percentage values above 98 or below 2.
* When a subgroup in this report has 10 or fewer students, showing their information may risk an individual student's anonymity. In these cases, we take care to hide either the number of students reported, the percentage, or both, and show * symbols instead. Similarly, when all students in a subgroup possess the same information, reporting 100% or 0% would violate each student’s anonymity. To protect students’ anonymity, we do not report percentage values above 98 or below 2.
End Of Year Promotion*When a subgroup in this report has 10 or fewer students, showing their information may risk an individual student's anonymity. In these cases, we take care to hide either the number of students reported, the percentage, or both, and show * symbols instead. Similarly, when all students in a subgroup possess the same information, reporting 100% or 0% would violate each student’s anonymity. To protect students’ anonymity, we do not report percentage values above 98 or below 2.
A Clear and Concise Description of the State’s Accountability System close Overview of the State’s Accountability System under Title IA-F Letter Grades: Arizona Revised Statutes § 15-241 requires the Arizona Department of Education, subject to final adoption by the State Board of Education, to develop an annual achievement profile for every public school in the state based on an A through F scale. The development of the Accountability System was informed by public input through 17 public hearings across the state and a survey that yielded almost 1,700 responses. Additionally, a broad-based committee consisting of school administrators, teachers, parents and data experts provided the Board with additional input.
The system measures year to year student academic growth, proficiency on English language arts, math and science. It also includes the proficiency and academic growth of English language learners, indicators that an elementary student is ready for success in high school and that high school students are ready to succeed in a career or higher education and high school graduation rates.
The plan adopted by the Board complies with state statute and the federal Every Student Succeeds Act while recognizing the opportunity to measure the quality of a school and its effectiveness across a broader range of measures than in the past.
The State’s n size, including any difference in the n size used for accountability vs. the n size used for reporting:
Both traditional school models require schools to have 10 FAY students in each indicator to be eligible to earn the points. Exceptions to this rule are:
Schools that do not meet the minimum size of 10 FAY students cannot earn points for that indicator.
The minimum number of students that the state has determined must be present in a student sub group, if the subgroup is to be included in accountability determination
Description of the State’s methodology for differentiating its public schools (including any special rules pertaining to specific categories of schools)
How the Grades are Calculated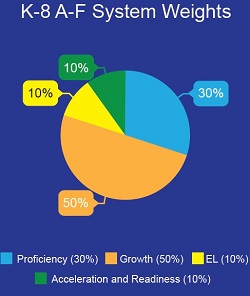
The Federal Every Student Succeeds Act (ESSA) requires states to identify schools for Comprehensive Support and Improvement (CSI) for overall low student achievement or low graduation rate and Targeted Support and Improvement Schools (TSI) for low subgroups achievement. Schools are identified every three years.
Description of the State’s methodology for identifying schools for targeting support and improvement (TSI) that have consistently underperforming subgroups, including the time period for making that identification
Targeted Support and Improvement Schools are any school in the state in which any subgroup of students (minimum of 20), on its own, would lead to identification as a CSI school. These schools are required to complete a comprehensive needs assessment, root cause analyses and Integrated Action Plan to improve student achievement in low achieving subgroups. Identified in 2018-19.
Description of the State’s methodology for identifying schools for comprehensive support and improvement (CSI)
Comprehensive Support and Improvement Schools are the lowest-performing 5 percent (minimum) of all schools receiving Title 1 funds and all public high schools in the State failing to graduate two- thirds or more of their students. These schools are required to complete a comprehensive needs assessment, root cause analyses and Integrated Action Plan to improve student achievement and graduation rates.
The State’s criteria for a school to exit CSI status before being subject to “more rigorous State-determined action”
Exit Criteria: CSI (low achievement)
Exit Criteria: CSI (low graduation rate)
All Comprehensive Support and Improvement Schools will be expected to exit within four years of identification, if not then they will be subject to “more rigorous State-determined action”.
The State’s criteria for a school to exit “additional targeted support” status before being identified for CSI, and the number of years after which that re-identification takes place
Exit criteria for additional targeted support schools:
CSI identification will be after 4 years.
Student Achievement in State Academic Assessment Detailed Results bar_chart Chart trending_up Trend list Data compare_arrows Comparison! “All Enrolled” displays the assessment results for all students that were tested and enrolled at the school. “Partial Year Enrolled” shows the assessment results for students that were tested at the school but were only enrolled for part of the year. “Whole Year Enrolled” shows the assessment results for students that were tested at the school and were enrolled for the majority of the school year. ! “All Enrolled” displays the assessment results for all students that were tested and enrolled at the school. “Partial Year Enrolled” shows the assessment results for students that were tested at the school but were only enrolled for part of the year. “Whole Year Enrolled” shows the assessment results for students that were tested at the school and were enrolled for the majority of the school year.
No data availableA-F Proficiency Points Earned (Out of 30)
This school currently is not receiving a letter grade due to its configuration. When the model is built that grades, additional information will be presented.
A-F Subgroup Proficiency Improvement Points Earned (Out of 10)
Select All No trend data available No trend data available1. Gray Bar – When a subgroup in this report has 10 or fewer students, showing the achievement information may risk an individual student’s anonymity. In this case, we do not report any achievement results for that subgroup.
2. When all students in a subgroup score at the same performance level, reporting “100%” or “0%” would violate each student’s anonymity. To protect students' anonymity we do not report the breakdown for each performance level.
3. EL-FEP includes students who are current English Learners and students who were formerly identified as an EL student within the past four years and have since tested proficient on the English Learner assessment.
4. In 8th grade, students have the potential to take one of four different mathematics assessments which include 8th grade Math, Algebra I, Geometry, and Algebra II. Mathematics results are displayed by name of the test for 8th grade students. The assessment group “GRADE 8 ALL MATH” includes the mathematics assessment results for all 8th grade students regardless of the particular test type (e.g., 8th grade Math, Algebra I, Geometry, and Algebra II). If, for example, an 8th grade student took the Algebra I test, those results are included in the reporting of the “ALGEBRA I”, “GRADE 8 ALGEBRA I”, and the “GRADE 8 ALL MATH” test results.
*When a subgroup in this report has 10 or fewer students, showing the achievement information may risk an individual student’s anonymity. In this case, we do not report any achievement results for that subgroup.
*When all students in a subgroup score at the same performance level, reporting “100%” or “0%” would violate each student’s anonymity. To protect students' anonymity, we do not report the breakdown for each performance level.
*EL-FEP includes students who are current English Learners and students who were formerly identified as an EL student within the past four years and have since tested proficient on the English Learner assessment.
In 8th grade, students have the potential to take one of four different mathematics assessments which include 8th grade Math, Algebra I, Geometry, and Algebra II. Mathematics results are displayed by name of the test for 8th grade students. The assessment group “GRADE 8 ALL MATH” includes the mathematics assessment results for all 8th grade students regardless of the particular test type (e.g., 8th grade Math, Algebra I, Geometry, and Algebra II). If, for example, an 8th grade student took the Algebra I test, those results are included in the reporting of the “ALGEBRA I”, “GRADE 8 ALGEBRA I”, and the “GRADE 8 ALL MATH” test results.
The grey bar that appears on this graph indicates potential impact from the COVID-19 pandemic which may impact how trends can be evaluated.
School year 2020-2021 assessment results should be reviewed cautiously as there were several impacts from COVID-19. Due to COVID-19, assessment participation rates were lower than previous years, which means fewer students were assessed than normal. It is also important to remember that the learning disruptions from COVID-19 may have impacted student learning and assessment results.
Please note: In Spring 2021, the AzSCI Field Test and MSAA Science Field Tests were administered to Arizona schools. Assessment results for these field tests are not available.
To see data on the percentage of students taking a state mandated assessment use the links below.