Integration of high throughput DNA genotyping and RNA-sequencing data allows for the identification of genomic regions that control gene expression, known as expression quantitative trait loci (eQTL), on a whole genome scale. Intramuscular fat (IMF) content and carcass composition play important roles in metabolic and physiological processes in mammals because they influence insulin sensitivity and consequently prevalence of metabolic diseases such as obesity and type 2 diabetes. However, limited information is available on the genetic variants and mechanisms associated with IMF deposition in mammals. Thus, our hypothesis was that eQTL analyses could identify putative regulatory regions and transcription factors (TFs) associated with intramuscular fat (IMF) content traits.
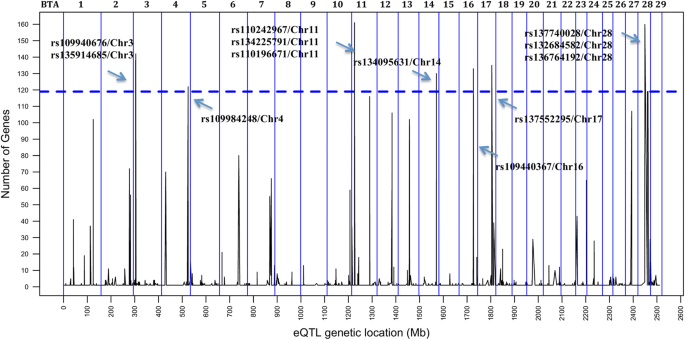
We performed an integrative eQTL study in skeletal muscle to identify putative regulatory regions and factors associated with intramuscular fat content traits. Data obtained from skeletal muscle samples of 192 animals was used for association analysis between 461,466 SNPs and the transcription level of 11,808 genes. This yielded 1268 cis- and 10,334 trans-eQTLs, among which we identified nine hotspot regions that each affected the expression of > 119 genes. These putative regulatory regions overlapped with previously identified QTLs for IMF content. Three of the hotspots respectively harbored the transcription factors USF1, EGR4 and RUNX1T1, which are known to play important roles in lipid metabolism. From co-expression network analysis, we further identified modules significantly correlated with IMF content and associated with relevant processes such as fatty acid metabolism, carbohydrate metabolism and lipid metabolism.
This study provides novel insights into the link between genotype and IMF content as evident from the expression level. It thereby identifies genomic regions of particular importance and associated regulatory factors. These new findings provide new knowledge about the biological processes associated with genetic variants and mechanisms associated with IMF deposition in mammals.
High-throughput genotyping and gene expression analysis combined with increased computational capacity and robust statistical methods allows for the identification of expression quantitative trait loci (eQTL). This approach can identify genomic regions that are associated with gene expression level [1,2,3] and can help to elucidate molecular mechanisms whereby genomic variants exert their effects on phenotypes or disease incidence [4, 5].
Adipose tissue is the largest endocrine organ in the body [6]. Within skeletal muscle, adipose deposition can occur within (intramyocellular) and external to (extramyocellular) skeletal muscle fibers. Lipid stored in skeletal muscle plays important roles in metabolic processes such as energy homeostasis, expression and secretion of hormones and proinflammatory cytokines, and in signaling pathways [7].
In humans, excessive fat deposition in skeletal muscle has been associated with metabolic diseases such as obesity, diabetes and coronary heart disease [8]. In contrast, in bovine, swine, and sheep, intramuscular fat (IMF) is positively associated with meat quality and consumer satisfaction [9], and can affect the final product price. Furthermore, the quantity and the fatty acid profile of the IMF present in edible red meat have both been positively and negatively associated with human health [10,11,12].
It is important to gain additional knowledge about the biological processes associated with IMF deposition and composition because of the important role of IMF deposition in areas such as human health and meat quality. Previously, Uemoto et al. [13], Ishii et al. [14], and our group have reported the identification of several quantitative trait loci (QTL) and putative candidate genes associated with IMF using high density SNP chip data [15]. In addition, we reported the identification of differentially expressed genes and putative candidate regulatory genes associated with IMF from RNA sequencing data (RNA-Seq) [16]. Furthermore, we have reported the identification of differentially expressed genes and gene networks associated with fatty acid composition in skeletal muscle [17]. However, so far there is no information on how genetic variation can influence gene expression and phenotypic variation associated with IMF content traits and composition [18,19,20]. Additional information can be gleaned by integrating the data of gene expression and whole genome association. Thus, the aim of this study was to perform eQTL analysis to identify putative regulatory regions and transcription factors (TFs) associated with intramuscular fat (IMF) content traits.
After the application of quality control filters, 461,466 markers and 11,808 genes from 192 animals were used in these analyses. The descriptive statistic of all phenotypes related to fat deposition and composition are shown in Additional file 1. The variance components and genomic heritability of these phenotypes for the whole population of this study have been estimated and previously reported by Cesar et al. [15] and Tizioto et al. [16]. The heritability of these phenotypes ranged from 0.09 to 0.46 (Table 1).
The cis-eQTLs were located in intronic (46%), intergenic (30%), upstream (11%), downstream (10%), and 3’ UTR (1%) regions (see Additional file 4A). The trans-eQTLs were located in intergenic (61%), intronic (30%), upstream (4%) and downstream (4%) regions (see Additional file 4B). Analysis of the associated SNPs located in coding regions (less than 1 %) revealed that 66 and 34% of cis-eQTLs (see Additional file 5) and 52 and 48% of trans-eQTLs (see Additional file 6) were either synonymous (not causing a change in the protein sequence) or missense (causing a change in the protein sequence) variants, respectively.
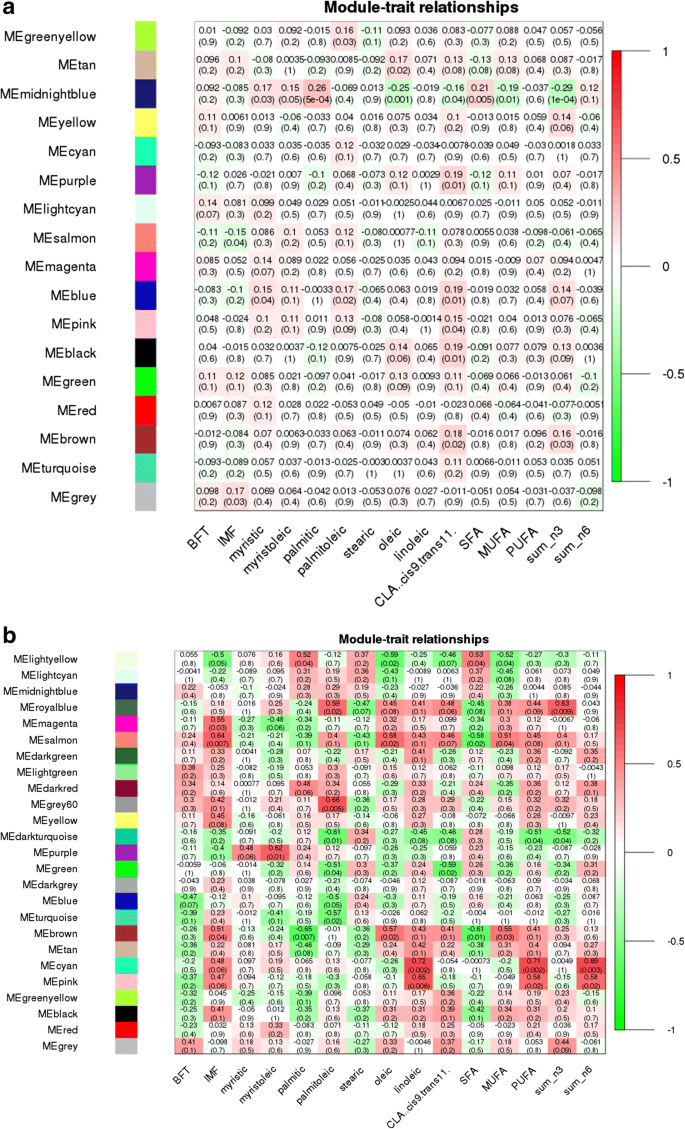
We used weighted correlation network analysis (WGCNA) to further explore how the three eQTL hotspot regions that harbor the TFs could affect gene expression and phenotype. For that, in each hot spot region, we selected the SNP with lowest p value to compare alternative genotypes for the hotspot. Unfortunately, we could not compare alternative homozygous genotypes because there were only two or three BB animals. So, the comparison was made between the homozygous AA vs heterozygous AB genotypes. This approach allowed us to identify the pattern of co-expressed genes assigned to various co-expression modules for both AA and AB genotypes and correlate them to the different traits related to IMF content traits. This correlation can represent the set of co-expressed genes that are associated with biological processes involved in lipid metabolic process in skeletal muscle.
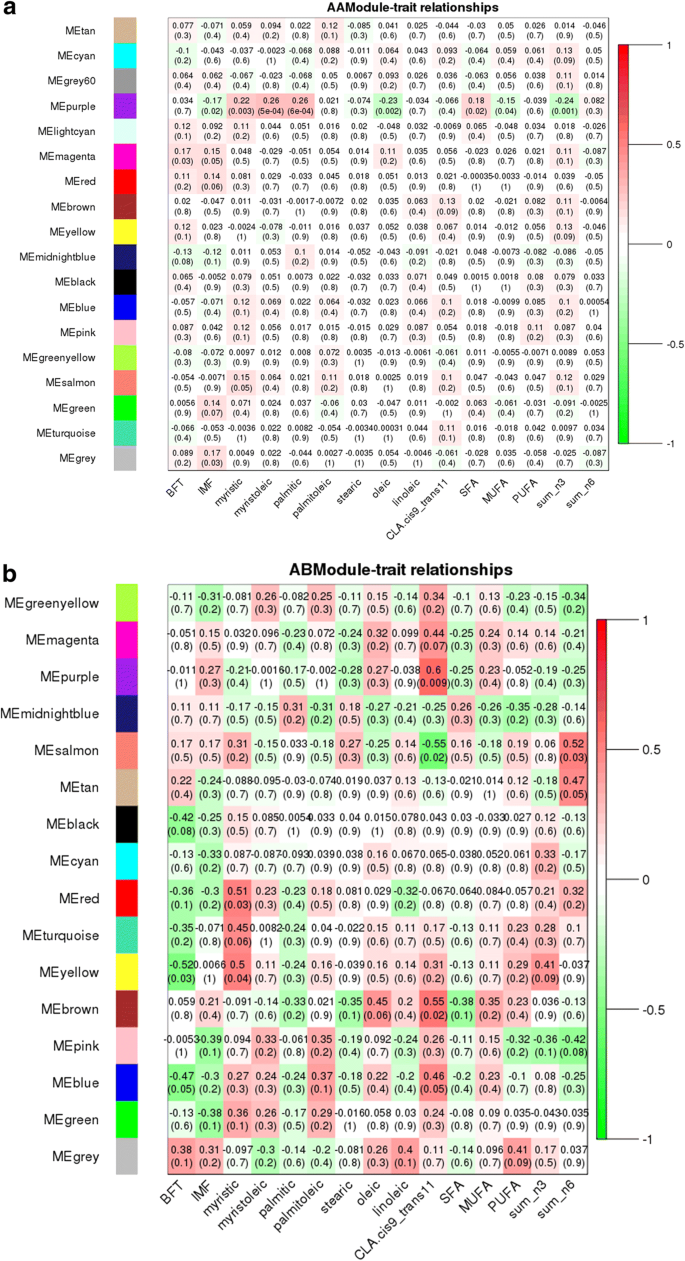
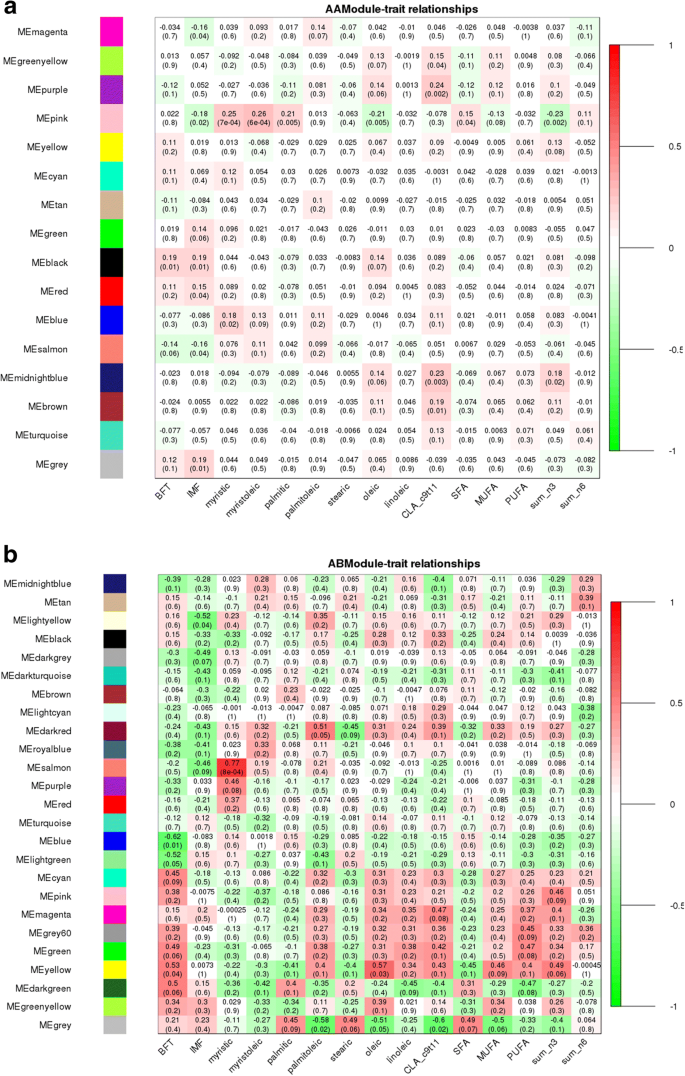
The eQTL hotspot region that harbored the USF1 TF (rs135914685) presented 17 and 25 modules for AA (n = 175) and AB (n = 17) genotype, respectively (Fig. 5a and b). The EGR4 TF (rs110242967) presented 18 modules for the AA (n = 174) and 16 for AB (n = 18) genotype, respectively (Fig. 6a and b). The eQTL hotspot region that harbored the RUNX1T1 TF (rs134095631) presented 16 and 25 modules for AA (n = 176) and AB (n = 16) genotype, respectively (Fig. 7a and b). After estimating the correlation values (r) between the modules and each trait of interest, modules that were correlated with at least three different traits were selected for functional enrichment analysis (p-value < 0.1). While the number of animals with a given hotspot genotype was very similar among the hotspot groups, the set of animals within a given hotspot genotype was different. It is important to point out that there is no selection for fat deposition or composition in this population.
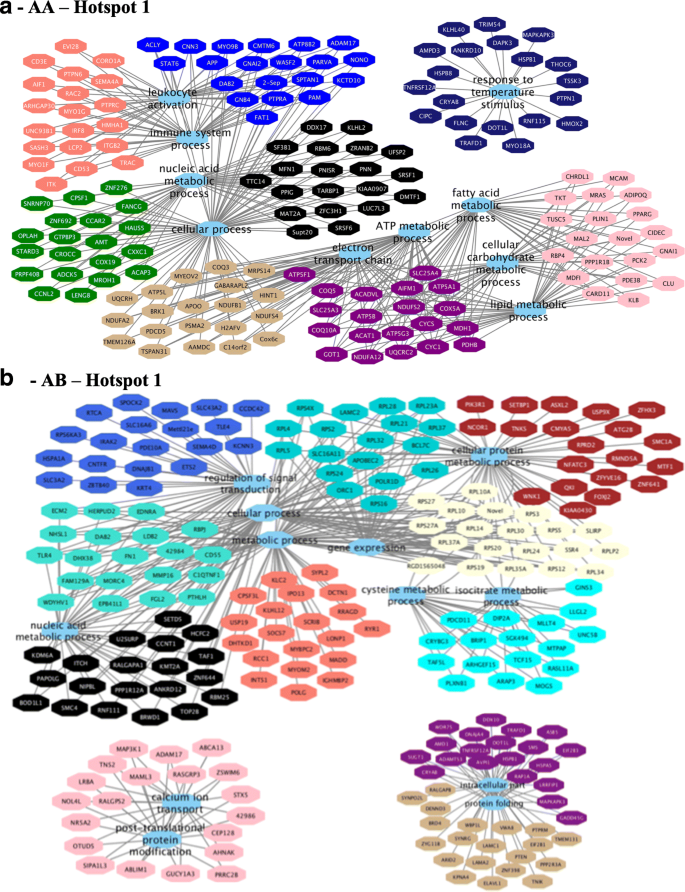
Functional enrichment analysis for hotspot 1 identified the following BP GO term for the AA (Fig. 8a) genotype: immune system process, lipid metabolic process, cellular carbohydrate metabolic process, fatty acid metabolic process, electron transport chain, oxidation reduction, and mitochondrial ATP synthesis coupled electron transport. For the AB (Fig. 8b) genotype, the following BP GO terms were identified: translation, gene expression, regulation of transduction, regulation of cell communication, and cellular process (see Additional file 17, sheets 3 and 4).
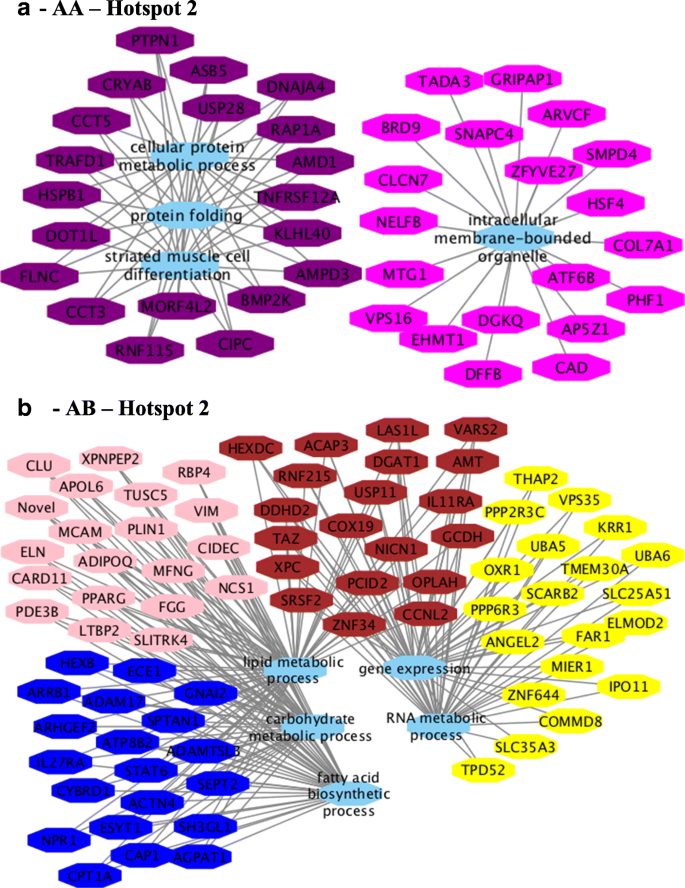
For hotspot 2, the following BP GO terms were identified for AA (Fig. 9a) genotype: intracellular membrane-bounded organelle and cytoplasm, protein folding, response to temperature stimulus, muscle structure development, cell differentiation, striated muscle cell differentiation and muscle cell differentiation. BP were as follows for the AB (Fig. 9b) genotype: signal transduction, lipid metabolic process, carbohydrate metabolic process, cellular lipid metabolic process, fatty acid biosynthetic process, gene expression, lipid biosynthetic process, RNA metabolic process (see Additional file 17, sheets 7 and 8).
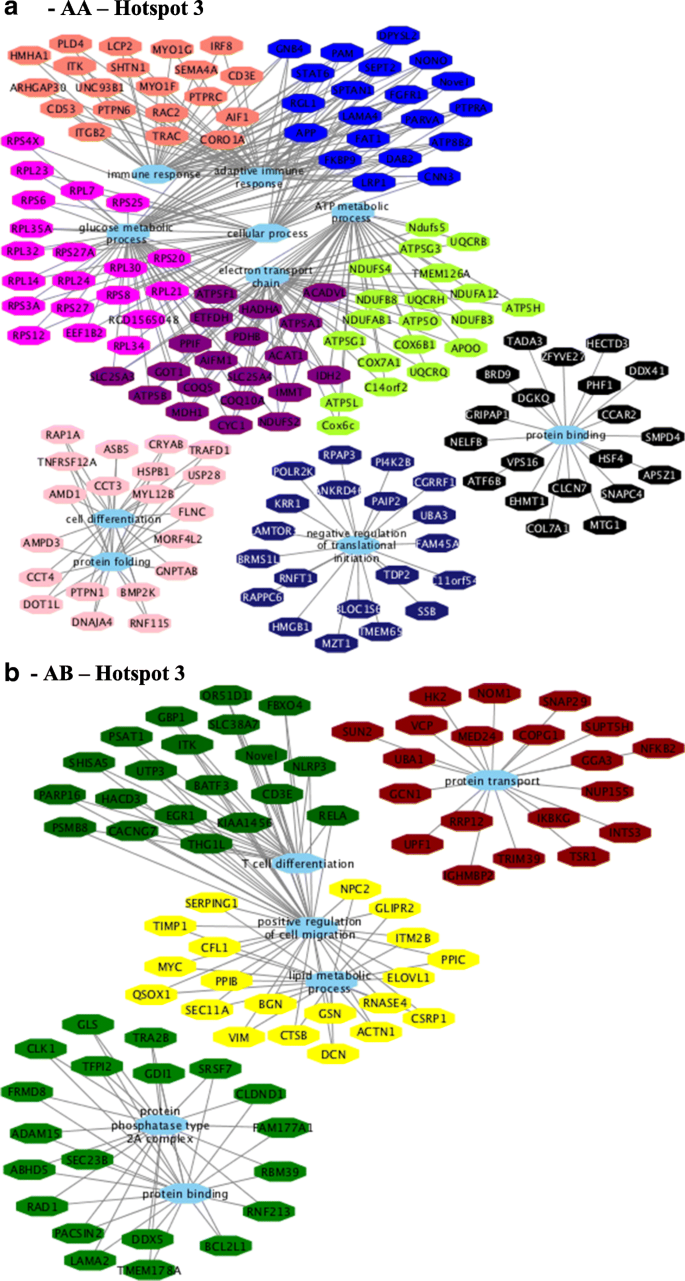
For hotspot 3, the following BP GO terms were identified for AA (Fig. 10a) genotype: electron transport chain, ATP metabolic process, protein binding, glucose metabolic process, and immune response. BP were as follows for the AB (Fig. 10b) genotype: and positive regulation of cell migration, T cell differentiation, protein binding, and lipid metabolic process (see Additional file 17, sheets 11 and 12).
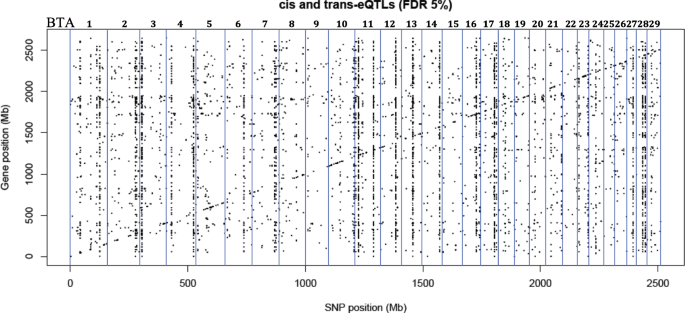
To our knowledge, this is the first eQTL analysis performed for complex phenotypes such as IMF content traits in bovine species. The association analysis between each of the 461,466 SNPs and the expression level of 11,808 genes expressed in muscle identified 1268 cis-eQTLs and 10,334 trans eQTLs that affected 243 and 1453 genes, respectively. These results agree with Wittkopp and Kalay [31] that described cis regulators that affected only a few genes and trans regulators having pleiotropic effect on many genes. The higher number of trans-eQTLs than cis-eQTLs was also reported by Ramasamy et al. [32].
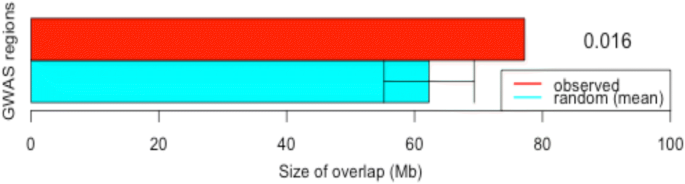
The overlapping test between eQTL and previous QTL regions support the hypothesis that many SNP-trait associations are mediated by changes in the expression level. Previous studies demonstrated that untranslated gene regions (UTR), such as 5′ and 3′ UTRs, introns and intergenic regions are involved in the regulation of expression [33] and that variation within these regions produce phenotypic variation [34,35,36].
In this study, although we used a panel of SNPs, in which most of the mutations are in introns and intergenic regions, we observed a enrichment of the intergenic regions for the identified trans-eQTLs. These findings corroborate the expected biologic function of the trans-eQTLs as potential distant regulators of gene expression [37].
Functional annotation of genes located near (2 Mb) cis and trans-eQTLs revealed biological processes GO terms such as transcription factor binding, protein binding, translation regulatory and transporter activities. Because of the presence of regulatory genes near eQTL regions, we suggest that these regions could be involved in modulation of gene expression and thus influencing quantitative traits [38, 39].
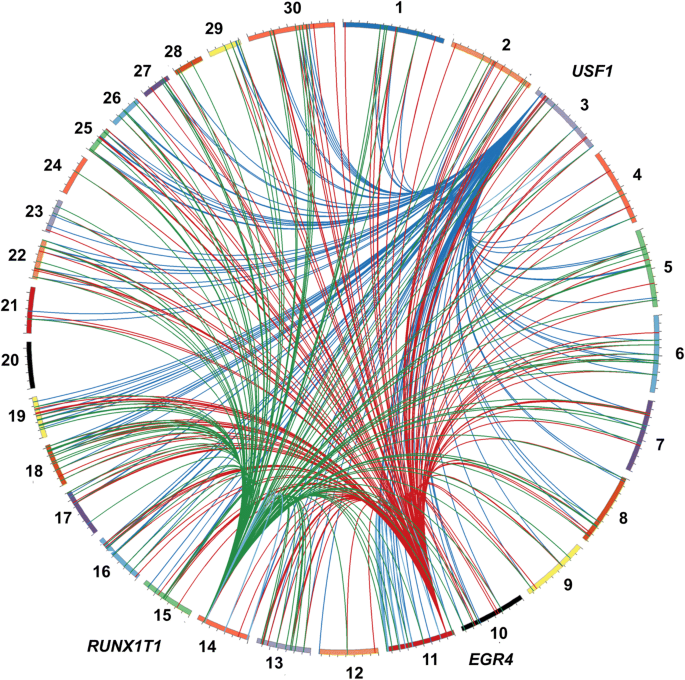
Cis-eQTLs are in general considered more important than trans-eQTL because of their local activity [40, 41]; however, recent studies have demonstrated that both cis- and trans-eQTLs are important to better understand the expression variation in different species [42, 43]. Among the trans-eQTL, some were associated with the expression levels of many different genes [see Additional file 3], which were defined as eQTL hotspots as described previously [44, 45]. This pleiotropic effect can be explained by the presence of a TF in the hotspot eQTL region [46]. Even though the annotation of the bovine genome for TF is not complete, we identified three annotated (JASPAR database) [47] TFs near (2 Mb) the following eQTL hotspots: USF1 (BTA3: 8117390–10117390), EGR4 (hotspot on BTA11: 10540044–12540044) and RUNX1T1 (BTA14: 79693309–74693309). The involvement of these TF was supported by the presence of TFBS in the promoter region of differentially expressed genes. In another study, authors also demonstrated that many of the harbored TFs identified within trans-eQTLs regions mediate the effect of inheritance of these loci on gene expression levels [46, 48]. In addition, the association test performed between these eQTL hotspots and the phenotypes confirmed the significant (FDR 5%) effect of these eQTLs on phenotypic variances of IMF content traits (Table 1).
The three annotated TFs identified near the eQTL hotspots were previously reported to be associated with lipid metabolism. USF1 (Upstream Transcription Factor 1) encodes a member of the basic helix-loop-helix leucine zipper family and has been linked to familial combined hyperlipidemia (FCHL) [49]. A recent report pointed USF1 as a new molecular link between lipid metabolism and energy expenditure, which is a potential therapeutic target for cardiometabolic disease in humans [50]. EGR4 (Early Growth Response Protein 4) is one of the prototypes of a family of zinc-finger transcription factors, which activates the transcription of target genes whose products are required for processes such as mitogenesis and differentiation [49]. EGR4 is an important TF in neuronal maturation and its expression is induced by cerebral ischemia and inflammation [51, 52]. Interaction of EGR4 and fatty acids with EGR1 and the PPAR pathway was associated with cardiovascular risk [53]. Finally, the TF RUNX1T1 (Runt Related Transcription Factor 1 Translocation Partner 1) is a transcriptional co-repressor that acts as a negative regulator of adipogenesis [49]. A recent study reported that RUNX1T1 is an inhibitor of brown adipogenesis (associated with a lean and healthy phenotype), which was associated with obesity and suggested that the miRNAs that downregulates this TF could be part of novel therapeutics to increase BAT (brown adipose tissue) in humans [54]. RUNX1T1 has been also implicated in epigenetic regulation as demonstrated in genome-wide methylation study following prenatal and postnatal dietary omega-3 fatty acid supplementation in pigs, which was differentially methylated between the treatments [55].
Other important candidate regulators were also identified in the hotspot eQTLs regions, such as nuclear receptors (NR1I3, NCOR, NRBF2), miRNAs (bta-mir-2294, bta-mir-1584, bta-mir-2322, and bta-mir-584-3) and small nuclear RNAs (SNORA70e, SNORA19 and SNORA9).
The nuclear receptor subfamily 1 member 3 (NR1I3) is an important regulator of xenobiotic, bile acid, and cholesterol/HDL metabolism, energy homeostasis [56]. While, nuclear receptor binding factor 2 (NRBF2) is associated with the mTORC1 activation by lysosomal cholesterol, which is directly dependent of fatty acid content [57].
The transcriptional corepressor NCOR, interacts with nuclear receptors and mediates the silencing of retinoid and thyroid receptors [58]. LXRs demonstrate higher affinity for NCOR in biochemical assays, which when up-regulated increases the synthesis of long chain FAs (PUFA). These FAs, such as palmitoleic acid, eicospentaenoic acid (EPA), and docosahexaenoic acid (DHA), are involved in anti-inflammatory activity [59].
Both small nuclear RNAs and miRNAs are non-coding regulatory RNAs, which utilize a similar set of processing enzymes. They are involved in several biological processes such as cell differentiation, cell proliferation, cell death, metabolic control, and transposon silencing [60]. It was interesting to observe that eQTL analysis also identified trans-eQTLs that act as post-transcriptional regulators.
It is known that DNA polymorphisms can alter complex phenotypic traits by modulating gene expression [4, 5]. Here we showed that genetic variation can influence gene expression, but the question of how alteration of gene expression could influence the phenotype remains unanswered. To further explore this question, we performed co-expression analysis that used the expression profile data between the two most frequently observed genotypes (AA and AB) of the three eQTL hotspot regions. Furthermore, we correlated the constructed modules with the phenotypes. These regions harbored the annotated TFs and are not in LD. WGCNA has been successfully used to investigate how gene expression changes are coordinated across transcripts and how these changes are associated with phenotype [61, 62].
Our results revealed significant differences in the pattern of the network construction (modules) for AA versus AB genotypes, as well as for correlation between network module eigengene (ME) values and phenotypic traits for all the three hotspots. The change in the number of modules present for each genotype may be attributed to the significant difference in co-activation of genes expressed in skeletal muscle, potentially due to regulation or mutation in these transcription factors. This would explain the differences in module content and GO enrichment results across genotypes. These findings also support the hypothesis that re-wiring of gene expression modulates pathways that can influence the traits under study.
Recent studies showed that hub genes (highly connected) tend to play important roles in co-expressed networks (modules) acting as potential regulators [63, 64]. Many hub genes and candidate genes for phenotypic variation were identified in this study such as TMEM39B, BCAR1, MED19, LIN37, TRIM54 and PPAR (see Additional file 17), were previously identified as differentially expressed genes between groups of animals with extreme values of IMF deposition and composition [17, 18]. The module-trait correlation analysis revealed connected modules and hub genes associated with BP such as immune response, leukocyte proliferation, lipid metabolism, and fatty acid biosynthesis for the different genotypes and hotspots. Some of these hub genes could be indicated as candidate biomarkers because they probably share similar functions. Second, several hub genes (RPL4, RPL5, BCL7C, KCNN3, DNAJB1, COX19, UBA6, UBA5) were associated with BP such as gene expression, nucleic acid metabolic, and RNA metabolic processes suggesting they play an important role in gene expression regulation. Based on the genotype specific differences in number of modules, module-trait relationships pattern, co-expression networks constructed, and the functional enrichment between the two genotypes, some hub genes identified in this study are plausible biomarkers for fatty acid variability such as TMEM39B and PPAR.
Genetic variation in the protein-coding region of a TF could modify the interaction of TF with TFBS. However, in our data we did not find any SNP in the coding regions of USF1, EGR4 and RUNX1T1 associated with the AA and AB genotypes, but one could not exclude the possibility that the observed effects result from linkage disequilibrium with a SNP not represented in the Illumina bovine chip. Alternatively, genetic variation in the promoter region of a TF could influence the abundance of the TF and thus alter expression of downstream genes. The low expression level of these TFs in our study could explain the lack of difference in TF gene expression between the AA and AB genotypes. Thus, further research is necessary to determine the causative mutation associated with the TF identified.
We identified several regions across the genome that affect gene expression level (expression quantitative trait loci, eQTL) and overlap with QTL regions associated with the deposition and composition of IMF. Some of these regions harbor TF and control the expression of several genes (hotspots). Results obtained supported the hypothesis that eQTL analysis can be used to identify putative regulatory regions and transcription factors associated with important phenotypic traits that are controlled by modulation of gene expression profile.
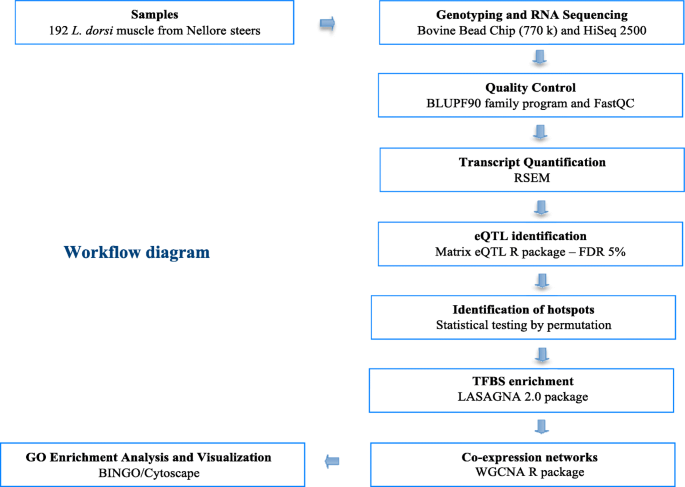
The animals (n = 192), phenotype and genotype data used in this study was comprised of Nellore steers sired by 34 unrelated sires, selected to represent the main genealogies used in Brazil according to the National Summary of Nellore produced by the Brazilian Association of Zebu Breeders (ABCZ) and National Research Center for Beef Cattle to ensure compliance with international guidelines for animal welfare as described previously by Cesar et al. [15]. A captive bolt pistol was used for stunning the animals prior to slaughter. SNPs with call rate ≤ 95%, minor allele frequency (MAF) ≤ 5%, those located on sex chromosomes or not mapped in the Bos taurus UMD 3.1 assembly were removed. The MAF threshold was chosen based on the sample size in order to minimize the number of false-positive and false-negative associations [65]. After filtering, a total of 461,643 SNP was utilized in eQTL mapping.
Total RNA was extracted from 100 mg of frozen LD muscle from 192 animals that were collected at slaughter using the TRIzol reagent (Life Technologies, Carlsbad, CA). RNA integrity was verified by Bioanalyzer 2100 (Agilent, Santa Clara, CA, USA). Only samples with RIN > 8 were used. A total of 2 μg of total RNA from each sample was used for library preparation according to the protocol described in the TruSeq RNA Sample Preparation kit v2 guide (Illumina, San Diego, CA). Average library sizes were estimated using the Agilent Bioanalyzer 2100 (Agilent, Santa Clara, CA, USA) and quantified using quantitative PCR with the KAPA Library Quantification kit (KAPA Biosystems, Foster City, CA, USA). Quantified samples were diluted and pooled (three pools of six samples each). Three lanes of a sequencing flowcell, using the TruSeq PE Cluster kit v3-cBot-HS kit (Illumina, San Diego, CA, USA), were clustered and sequenced using HiScanSQ equipment (Illumina, San Diego, CA, USA) with a TruSeq SBS Kit v3-HS (200 cycles), according to manufacturer’s instructions. Sequencing analyses were performed at the Genomics Center at ESALQ, Piracicaba, São Paulo, Brazil.
Sequencing adaptors and low-complexity reads were removed in an initial data-filtering step. Quality control and read statistics were estimated with FASTQC version 0.10.1 software [https://www.bioinformatics.babraham.ac.uk/projects/fastqc/]. RNA-Seq by Expectation Maximization (RSEM) approach was performed to estimate the number of fragments originating from each gene in each replicate library, which is capable of handling reads that map ambiguously between isoforms and genes, and minimize the differences in total read counts across samples (normalization procedure) [66]. The UMD3.1 Bos taurus assembly available at Ensembl [http://www.ensembl.org/Bos_taurus/Info/Index/] was used as reference genome.
The Matrix eQTL R package [67] was used to identify associations between genetic variation from genotype (SNPchip) and gene expression (RNA-Seq) [68]. Contemporary group (including farm, year and slaughter date) and lane were included in the model as fixed effects and age as a covariate. Markers associated with variation in gene expression that were within 1 Mb of the gene were defined as cis-eQTLs (local variants), while markers more than 1 Mb from the gene were defined as trans-eQTLs (distant variants). Matrix eQTL tests the association between each marker (SNP) and each gene assuming the effect of genotype as additive, performs a separate test for each pair (marker and gene) and corrects for multiple tests by calculating false discovery rate (FDR) [69]. The estimated effect size (slope coefficient) and the genetic variance explained by the markers was also provided according the Matrix eQTL package [66]. eQTL hotspots (markers that affect the gene expression level for many genes) were identified by permuting the distribution of eQTLs across the genome after 1000 permutations. A hotspot threshold was identified that corresponded to the 95th percentile of the value. Linkage disequilibrium (LD) analysis and visualization by PLINK v.1.07 [70] and Haploview [71], respectively, were used to check if the hotspots were in LD with each other and if so to select just one as the eQTL hotspot. The hotspot region was defined as a 4 Mb window around the hotspot eQTL, i.e. 2 Mb extended to each side of the hotspot eQTL.
The analysis of variance (ANOVA) model containning contemporary group (including farm, year and slaughter date) and lane as fixed effects and age as a covariate and was applied to test for association between a given SNP and a corresponding phenotype. Evidence of population stratification was not identified in this population based on previous results reported by our group [72]. Therefore, it was not included in the model to detect eQTL. The statistical test was performed by R software and applied to verify the effect of the eQTL hotspots identified in this study on the phenotypes of interest. The correction for multiple tests was applied by calculating false discovery rate (FDR 5%).
Overlap analysis was carried out using the Bioconductor package regioneR [24]. The package implements a general framework for testing overlaps of genomic regions based on permutation sampling. We repeatedly sampled random regions (N = 1000 permutations) from the UMD_3.1 genome assembly matching size and chromosomal distribution of the detected eQTLs. This test was performed for QTL class, QTL associated with traits of production and quality of carcass and meat, and QTL previously reported by our group [15] associated with the traits of interest in this study. In every permutation, the overlap with the cattle QTLdb [23] was recomputed based on the total genomic size in Mb that was overlapped.
The eQTL annotations were performed using Ensembl Variant Effect Predictor, a free toolset for the analysis, annotation, and prioritization of genomic variants in coding and non-coding regions [73]. The reference genome assembly used was UMD3.1 Bos Taurus from Ensembl data bank [73]. With this set of tools, the location of an eQTL in relation to a gene can be defined as outside of the gene, in the coding sequence, or in untranslated regions (UTR). The functional impact was determined for those eQTLs that were localized in the coding sequences. Functional enrichment analyses were performed with Protein ANalysis THrough Evolutionary Relationships (PANTHER) [26] using the list of the genes harbored in 4 Mb eQTL regions (hotspot, cis and trans). The statistical over-representation test by PANTHER was used to obtain the gene ontology association (biological processes and protein classes) from a given list of genes. That test was performed to compare a list of reference genes (background, all genes expressed in skeletal muscle identified in this study) to a list of genes harbored within 4 Mb eQTL regions, and determine if a particular class of gene ontology (GO) biological processes were over-represented or under-represented (nominal p-value ≤0.05).
Annotated transcription factors (TFs) by JASPAR CORE database [42] were searched within the eQTL hotspot region, and the transcription factor binding sites (TFBSs) of these TFs were searched using LASAGNA-Search 2.0 [28]. LASAGNA-Search 2.0 is an integrated web tool based on the algorithm Length-Aware Site Alignment Guided by Nucleotide Association, which allows the identification of TFBS from a list of target genes. To perform the LASAGNA-Search 2.0 program, the TFBSs and position-specific scoring matrix (PSSM) were collected from JASPAR CORE database; the name of the TFs were chosen based on the Bos taurus genome annotation; and the list of target genes was the list of gene affected by the eQTL hotspots identified herein. This method used by LASAGNA 2.0 can distinguish true binding sites from other non-functional sites with similar sequences by giving a weighted match to any given substring (combinations) of fixed length. The TFBS were searched in 1500 bp of length of promoter region obtained from Biomart tool of Ensembl website [http://www.ensembl.org/biomart] of those genes that were affected by eQTL hotspot for the specific TF.
Hotspot eQTLs were chosen that had annotated TFs within them to associate the hotspot eQTLs with the traits of interest (IMF deposition and composition). WGCNA (Weighted Gene Correlation Network Analysis), which is a systems biology network method that describes the correlation patterns among all expressed genes across samples, was performed by WGCNA R package [74]. This approach was used to identify the differences in co-expression networks between hotspot eQTL genotypes (AA and AB, MAF > 0.05). Gene networks were constructed separately for each of the two most frequent genotypes, which were assigned an arbitrary color. For WGCNA analysis, the correlation matrix was built using the absolute value of the Pearson correlation coefficient between all gene pairs across all samples. The Pearson correlation matrix was subsequently transformed into an adjacency matrix (A) using a power function based on scale-free topology criterion, as described [75]. A soft threshold power of 6 with scale free fitting index of 0.9 was applied to calculate the adjacency matrix. TOM-based dissimilarity (1-TOM) was used for module identification using Dynamic Tree Cut algorithm with cutreeDynamic function in WGCNA package [74] and defining the deep split = 2 and minimum module size = 30. To make the genotype networks comparable, for each eQTL hotspot, we scaled the TOM (Topology Overlap Matrix) connectivity’s in genotype with the minimum number of data such that its 95th percentile equals the 95th percentile of the genotype with maximum number of data, as described by Langfelder and Horvath [76]. To quantify co-expression similarity of entire modules, we calculated their eigengene values using moduleEigengenes function in WGCNA package and clustered them based on their correlation using height cut of 0.25, which corresponded to a correlation of 0.75, to merge similar modules [76]. All other WGCNA parameters remained at their default settings. Grey-colored modules contained all genes that were not part of any module. The associations between individual genes with traits of interest (fat deposition and composition of intramuscular fat, adjusted phenotype as described by Cesar et al. [18] was quantified by the Gene Significance (GS) approach, which was defined as the correlation (the absolute value) between the gene and the trait of interest. The quantitative measure of module membership (MM) was defined as the correlation of the module eigengene and the gene expression profile. With these assumptions, the similarity of all genes was quantified to every module. The p-value threshold applied in this correlation analysis was p-value < 0.10 based on previous studies that used the same approach [19, 77].
Conjugated linoleic acid